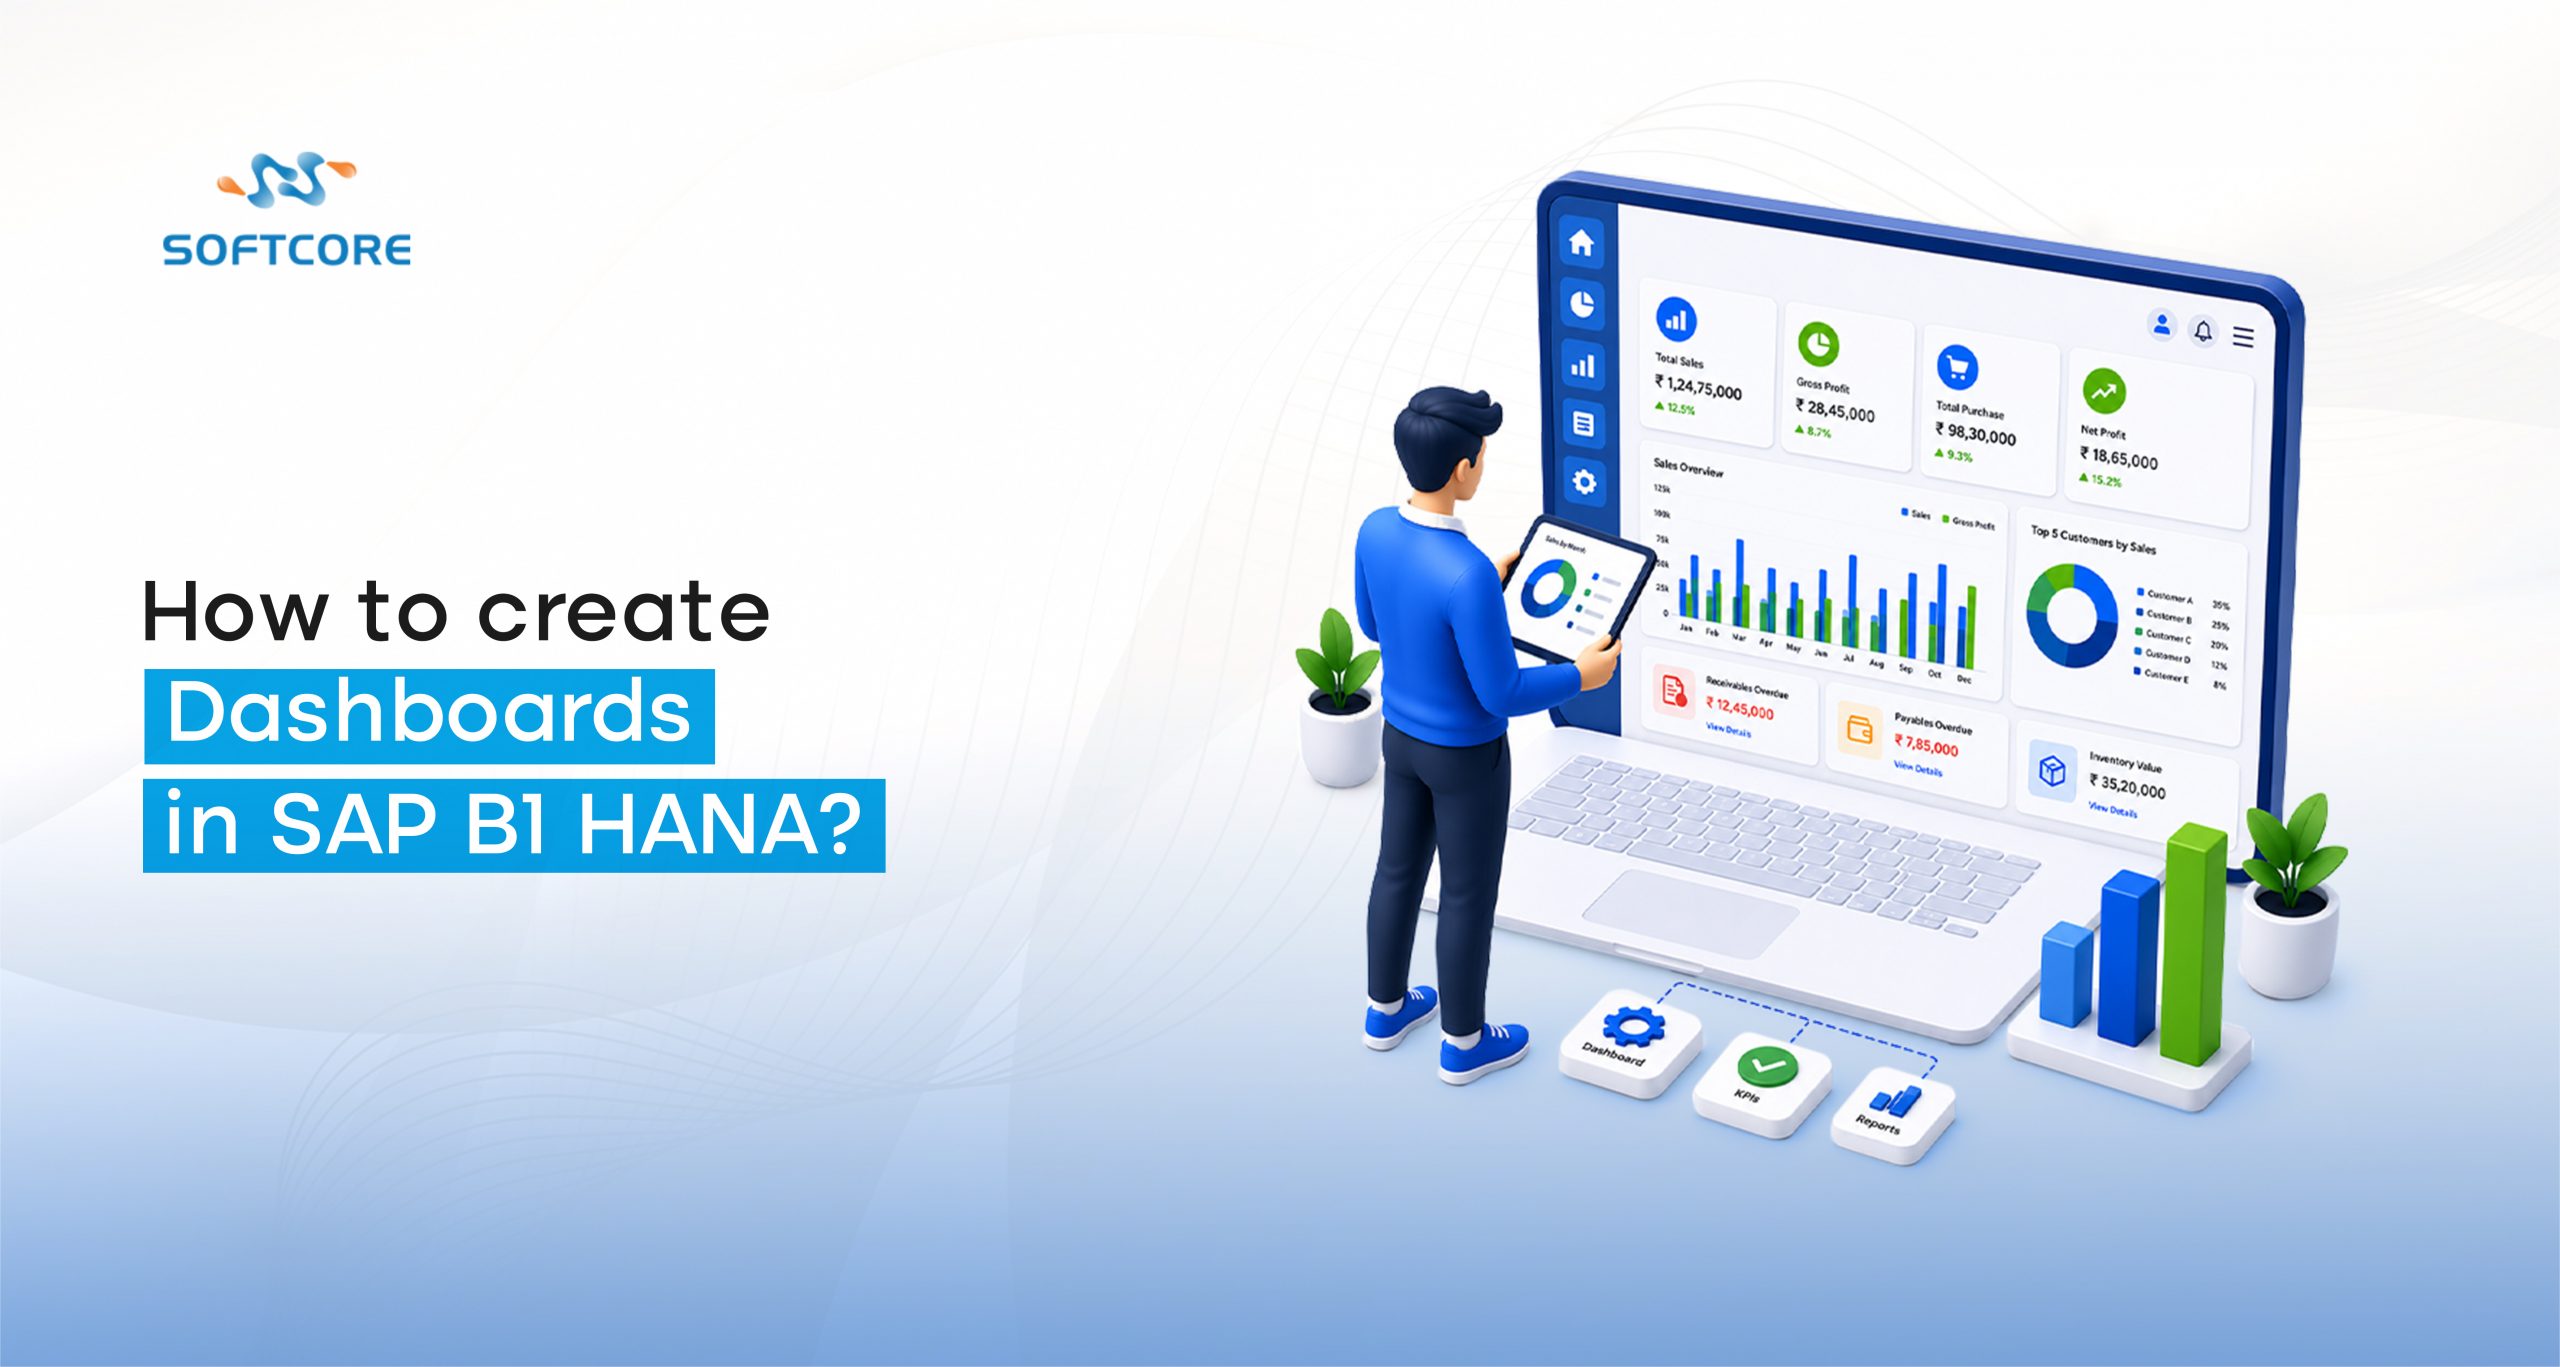
How to Create Custom Dashboards in SAP B1 HANA?
It is easy to create custom dashboards in SAP Business One with the help of the Pervasive Analytics Designer (Desktop Client) or the Analytics/List View (Web Client). To create a custom dashboard in SAP B1 ERP, select a query or data source, define the numeric measures and grouping dimensions, and pin the final widget to your cockpit or home screen for real-time visibility. This way, businesses can have smart insights for strategic business action.
How to Create a Custom Dashboard in the SAP B1 Desktop Client?
The Desktop client utilizes the Pervasive Analytics tool to transform data from the Query Manager into visual widgets.
Creating a Query: Create an SQL or HANA query on the OITM table (Item Master Data table for inventory) and save this query in Query Manager to a folder.
Opening Pervasive Analytics: Go to Tools > Pervasive Analytics > New Dashboard.
Data Binding: Choose your saved query from the defined folder. Drag fields under Target Measures (numerical data) and Target Dimensions (grouping data) to visualize the dashboard.
Completing and Naming: Select a visualization method of your choice and give your dashboard a descriptive name as you save it.
Publishing to Cockpit: Go to your home screen cockpit, press the Plus (+) sign and find the dashboard from the listed items. Once done, click on the pin button. Now the dashboard would be available and one can resize it as per their preference.
This is an alternative method that focuses on analytics, whereby any list of records could be made into a dashboard tile.
List View Visualizations
The List View is a major analytical tool. It can be toggled to either Table View, Chart View, and Card View via icons at the top of the screen.
Adapt Filters: This allows you to filter your data (e.g., by date and status).
View Settings: You can rearrange your columns to make certain key fields such as “Sales Employee Name” primary.
Save as Tile Method
In order to save as a permanent dashboard:
– Configure the filters and groupings of the List View.
– Click on the Share icon and choose Save as Tile.
– Name your tile and subtitle as well as assign it to a home group.
General Overview
General Overview offers a complex dashboarding environment. Contrary to standard List Views, it provides the capability of cross-source reporting whereby cards from different sources of data (e.g., Sales vs. Purchasing) can be placed on the same screen. Notably, this tool has the capability to use Custom Queries as a data source.
Benefits of Custom Dashboards in SAP Business One
How to Create a Sales Performance Dashboard in SAP Business One?
Let’s create a custom dashboard in SAP B1 that gives businesses a view of revenue versus profitability based on employee sales performance. One would proceed as follows;
| Setting | Configuration |
|---|---|
| Goal | Visualize Document Total vs. Gross Profit by Sales Employee. |
| Filters | Set Year to 2026 and Quarter to Q2 via Adapt Filters. |
| Visual Style | Chart View (Column or Bar Chart). |
| Measures | Document Total, Gross Profit. |
| Dimensions | Sales Employee Name. |
| Interactivity | Hover over data points for totals; use Control or Shift for multi-selection. |
Which Analytic View Should You Choose for Your Custom Dashboard in SAP B1
Not all view types are suitable for all dashboards. Certain data is best displayed in a specific view. Following list will help to decide on the view type for custom dashboards in SAP Business One.
| View Type | Visual Style | Best For |
|---|---|---|
| Table View | Grid / Rows | Detailed record review and manual data accumulation. |
| Chart View | Bars, Lines, Pies | Identifying trends and comparative performance. |
| Heat Map | Multi-dimensional | Complex, color-coded representation of 3+ data ranges. |
| Card View | Individual Tiles | Monitoring specific KPIs or single-metric snapshots. |
| General Overview | Composite Screen | Dashboards requiring data from multiple different sources or custom queries. |
Closing Thoughts:
There you have it. Creating custom dashboards in SAP Business One is a piece of cake. We highly recommend you create one for your business’s KPIs for faster decision-making. SAP Business One is not just about flashy dashboards it is much more than that.
We at SoftCore Solutions help businesses go beyond the flashy dashboards and help deliver SAP Business One implementations that actually deliver ROI swiftly. With our ERP expertise spanning over 24+ years, we help you get the most out of SAP Business One. Book a live demo with our expert team and let us simplify your processes to grow your business with SAP Business One.
Frequently Asked Questions (FAQs)
If tiles (particularly in Accounting) are missing for super-users, this usually indicates a version or patch level issue. Reference SAP KBA 3740257 to check if an upgrade is required for your specific environment.
Yes. When using the General Overview tool, you can select Custom Query as the data source for a card, providing full flexibility over the visualized data.
Use Adapt Filters to add date fields. For dynamic dashboards, using a Date Offset (e.g., “Last 30 Days”) is recommended so the tile refreshes automatically as time passes.